

 Tom Dewar
Connecting Posit Workbench (RStudio) to GitHub with HTTPS
If you're an RStudio user using Posit Workbench and want to use GitHub for source control (you should), this is the guide for you. There are two ways...

We are cursed to live in interesting times. As I write this, a war in Ukraine rumbles on, we sit on the tail of a pandemic and at the jaws of a cost-of-living crisis, energy prices and borrowing costs are soaring and volatile, the pound is near an all-time low, and the UK has its third prime minister in as many months. It is a turbulent and frosty time to be running a business.
In this environment, it is tempting to see business investment in data and analytics as a luxury, a cost to be cut. But this is folly. Organisations that harness the power of their data are not just more profitable in good times, they are also more resilient in hard times.
Here are five reasons why.
There is never a bad time to have your finger on the pulse of the business. But when things move fast, it is more important than ever. You need to be able to spot changes early and react.
If it takes you until March to find out what happened in January, it's too late. Like trying to drive a car where your only input is a video replay of the rear view mirror.
Automating the reporting of key metrics can hugely reduce this dangerous lag on management information. And tracking leading indicators, not just lagging ones, means you can look forwards not just back.
For example, monitoring the number of new leads per week and the ratio of leads to sales – direct from your CRM – will give you a more timely heads-up of problems in your sales pipeline than just tracking sales.
Use your data to understand what drives your costs, where your profits really come from and where the opportunities lie to squeeze margins in your favour. Good use of data will give you a grip on the status quo. Better use and you'll understand the trends. Best use and you'll see how these trends, and changes in them, will open up new risks and opportunities for you to manage and exploit.
If you had to narrow your product line, what should you focus on: the products that are most profitable today, or the ones which will be most profitable tomorrow?
A joke in the analytical fraternity goes that the only thing you can be certain of with a forecast is that it will be wrong. This is true, but a deliberate missing of the point (that's the joke). There is value in making predictions if you base them on data, ask the right questions and know how to parse the answers.
Good predictions are ones made free of bias. Human judgement, on its own, is a poor tool. People are bags of biases, hard-wired to overestimate benefits and under-estimate costs. Just ask any project manager.
Using data we can make better predictions, use these to make better decisions and expect better outcomes.
There are only two fundamental ways to use data to make a prediction about a measure of interest.
All the fancy techniques you have ever heard of can be categorised as one of these two, or a combination. (Though there is a skill in knowing which to use when.)
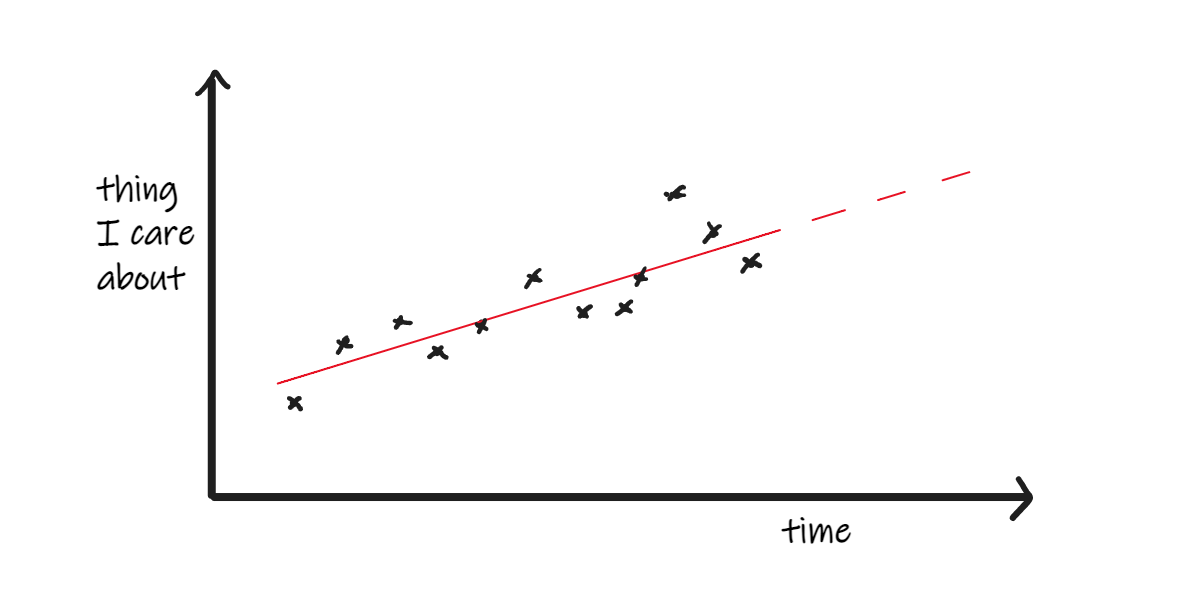
If you've ever drawn a chart with [thing I care about] on the y-axis and time on the x-axis, and then drawn an extended line through it, congratulations, you are a forecaster. But I hope you'll appreciate how much harder it would be to draw the line if you did not have any data points on which to base it.
This is perhaps the most powerful and under-appreciated use of data you can make to support decision-makers in your business.
A 'what-if' model is a simplified version of the business realities you care about with three key features.
For example, a model to support recruitment planning might have input parameters for staff turnover, predicted workload and time-to-train new recruits, and outputs showing when you will be over- or under-resourced across different scenarios. This could be as simple as an Excel spreadsheet, but more complex models will need more powerful tools – like R or Python – and someone with the requisite skills to use them.
Using 'what-if' models give you a richer and more systematic understanding of the choices you face and a handle on uncertainty.
If you have streamlined your data operations this means you have all the key information at your fingertips as an automated by-product of your staff doing their operational jobs.
Having therefore minimised or eliminated the admin and management effort required to obtain this key information, it means you can scale operations up (or down) without impacting on information quality nor adding to the administrative burden. Your operational staff spend more of their time doing the thing you hired them for, improving productively.
Not sure whether your business is making best use of its data, or how to put these into practice?

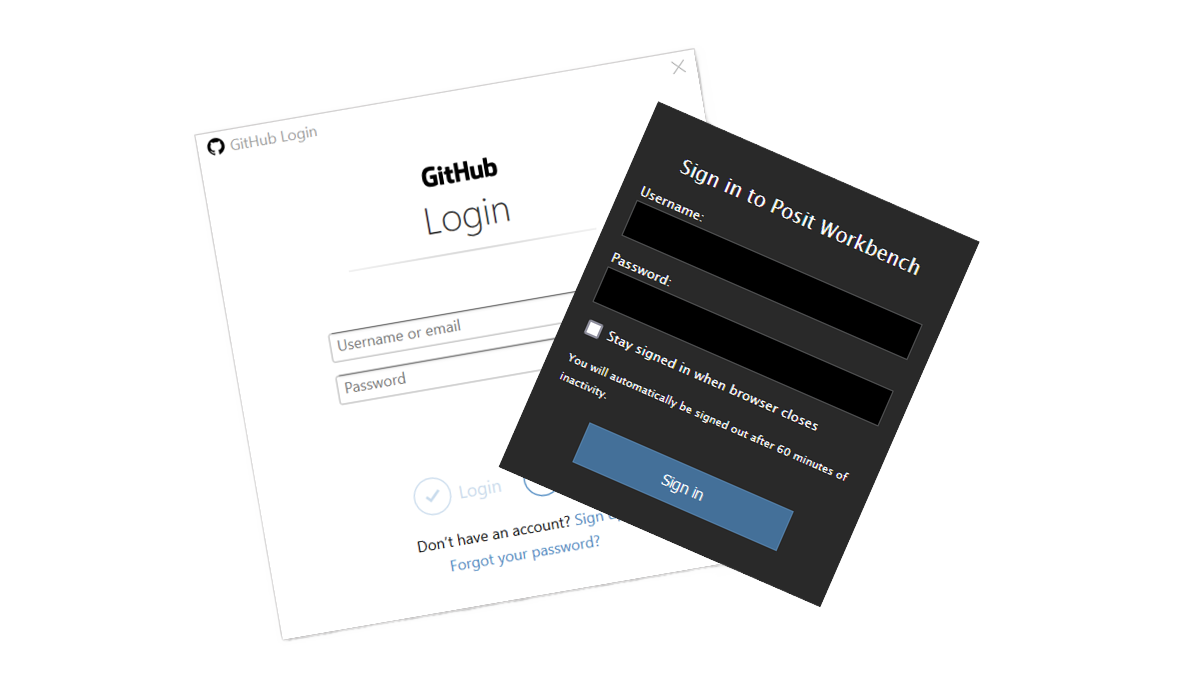
If you're an RStudio user using Posit Workbench and want to use GitHub for source control (you should), this is the guide for you. There are two ways...

Many companies investing in data analytics struggle to achieve the full value of their investment, perhaps even becoming disillusioned. To understand...
We are cursed to live in interesting times. As I write this, a war in Ukraine rumbles on, we sit on the tail of a pandemic and at the jaws of a...